Leafletting is an important part of running a successful election campaign. Decent maps are essential for determining where the administrative boundary sits and for making sure your leaflets reach all your potential voters.
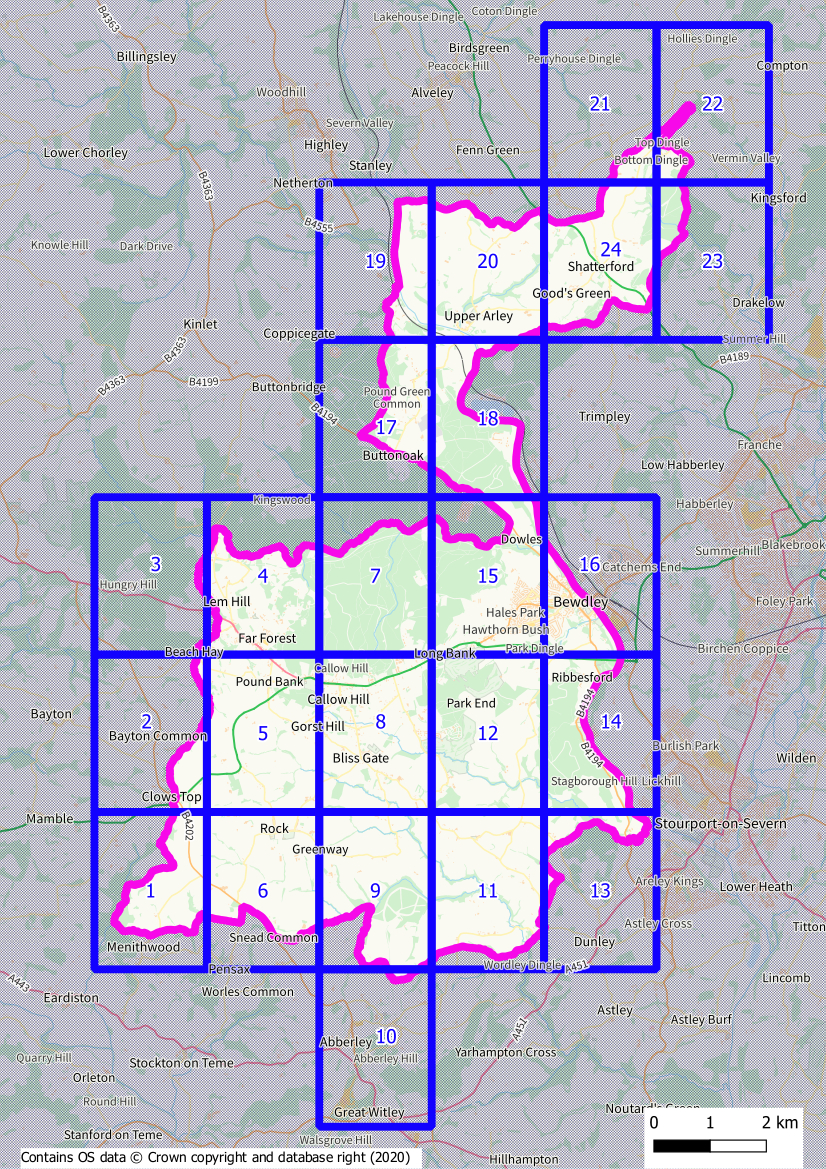
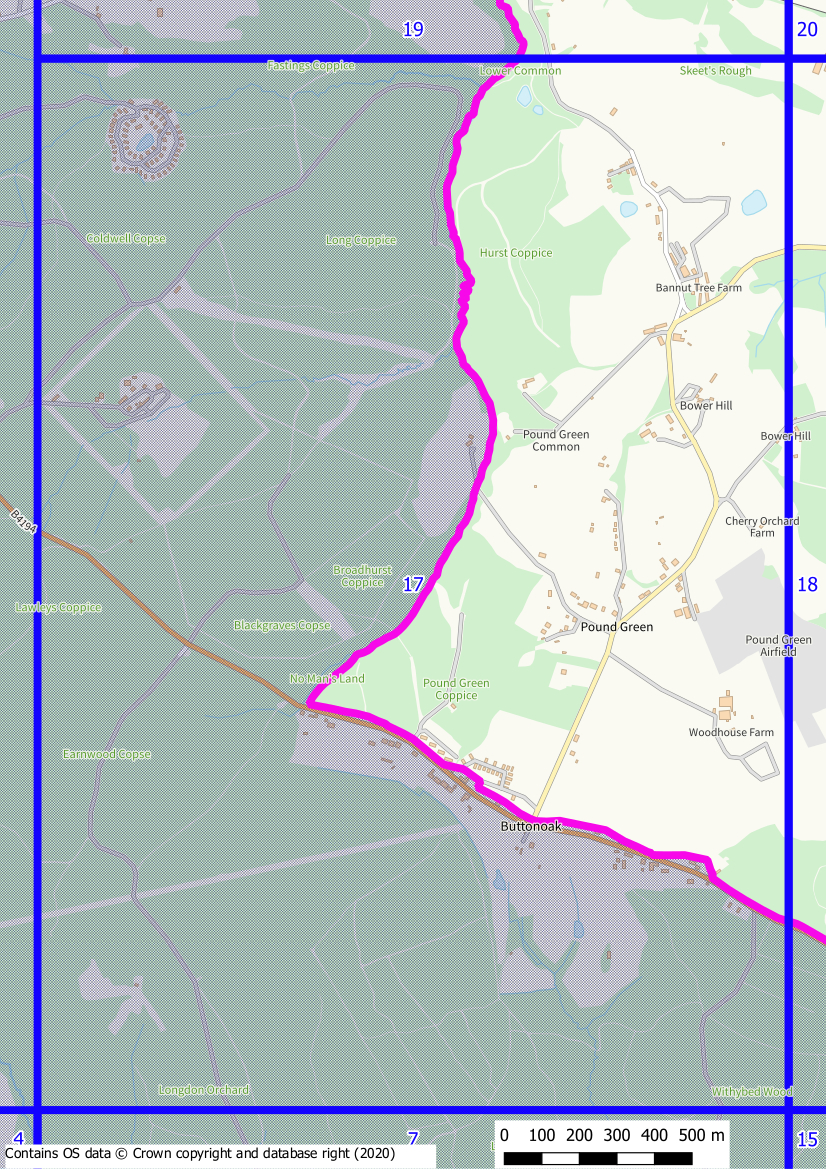
I produced the following maps for the Green Party in the recent Worcestershire County Council elections. The data is all Ordnance Survey OpenData, I used OS Boundary-Line first to clarify the constituency extents (pink outline on the map below) over an OS Open Zoomstack background. I then hatched everything outside of the electoral boundary and added a grid. The grid is necessary to split the overview into smaller, more detailed, maps that can be taken out when delivering leaflets. Splitting the map was done with the Atlas function on the QGIS Print Layout tool. It simply takes a unique attribute in a polygon, in this case the grid rectangle and sheet number, and produces an output (PDF or PNG) for each, on the same print template. This speeds up the process enormously as you only need to create the template once, so no dragging scale bars and north arrows around for hours! You can also set the Atlas to add a title from an attribute in the data.