I wanted to contest a local planning application which made the unsubstantiated claim that a housing development would have minimal visual impact on the landscape. This seemed a subjective conclusion to me with no evidence from quantifiable analysis to make such a statement. I presume a local council planning officer had stood next to the green field site where the planning application was made, pictured the development in their head and made an opinion.
Anyway, I had been looking for a reason to try out the QGIS Visibility Analysis plugin for a while…
A viewshed is simply a map of areas of visibility to an observer. The map must be created with an elevation terrain model and is usually displayed with a topographical map draped over it.
In this case my observer would be a person standing next to the proposed development site, my draped map would be a section of OpenStreetMap and my Terrain model is a chunk of Environmental Agency 1m LiDAR, digital surface model. The data and software are all open source.
Creating the viewshed with the QGIS Visibility Analysis plugin is a two-step process. First a viewpoint needs to be established, this is my observer, positioned on the terrain model and assigned a height, in this case 1.6 metres, the average height of a person. This means that my person is standing at the correct height on the correct elevation. The maximum distance can also be set, this would be the distance a person could see on a flat plain, with no obstructions.
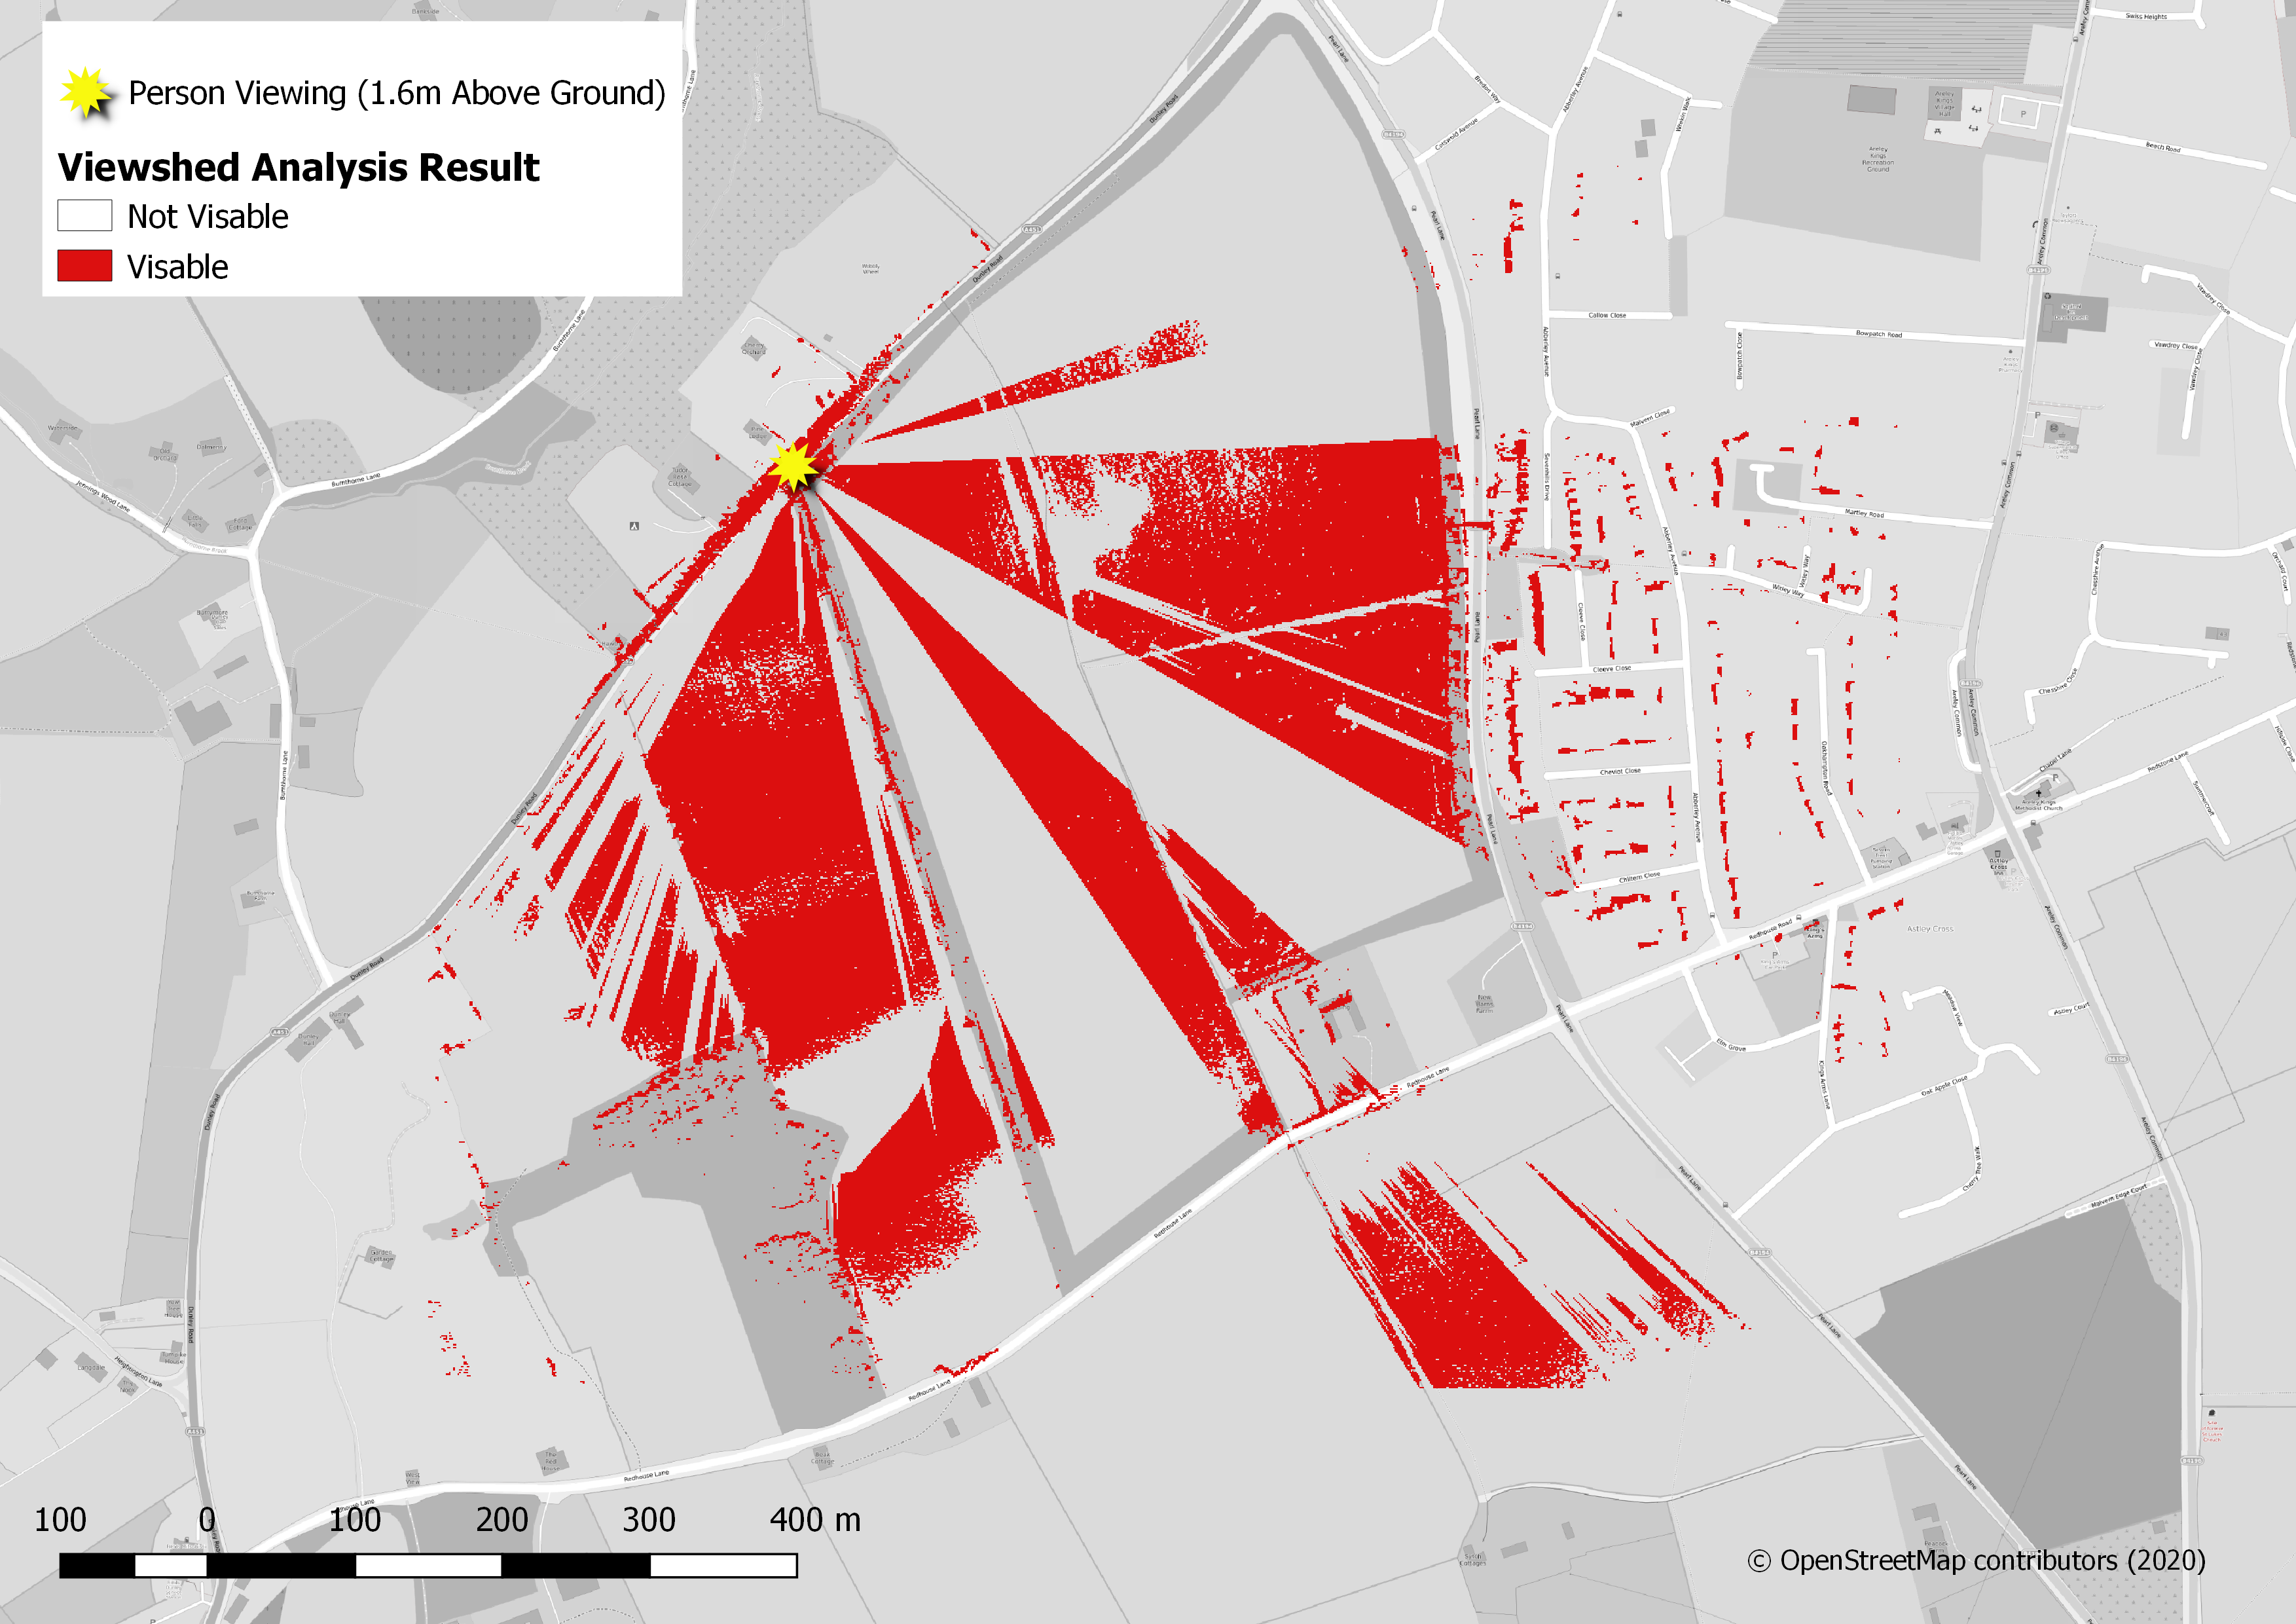
The next step is to run the viewshed with these parameters, the output map can be seen below, the red areas are visible to the observer, these are areas that are not obscured by surface features such as trees, higher ground elevation and buildings.